
The Solar Revolution: How the UK Grid Handles Sunny Days
Solar capacity in the UK has grown from virtually nothing to over 16GW. Discover how the grid manages this variable renewable source, forecasting challenges, and what records have been broken.
The United Kingdom may not be famous for its sunshine, but solar power now plays a crucial role in the nation's energy transition. On peak summer days, the UK's solar fleet can supply more than 30% of the country's electricity demand, a major achievement for a nation positioned between 51° and 55° north latitude (National Grid ESO, 2024).
The Growth of UK Solar Power
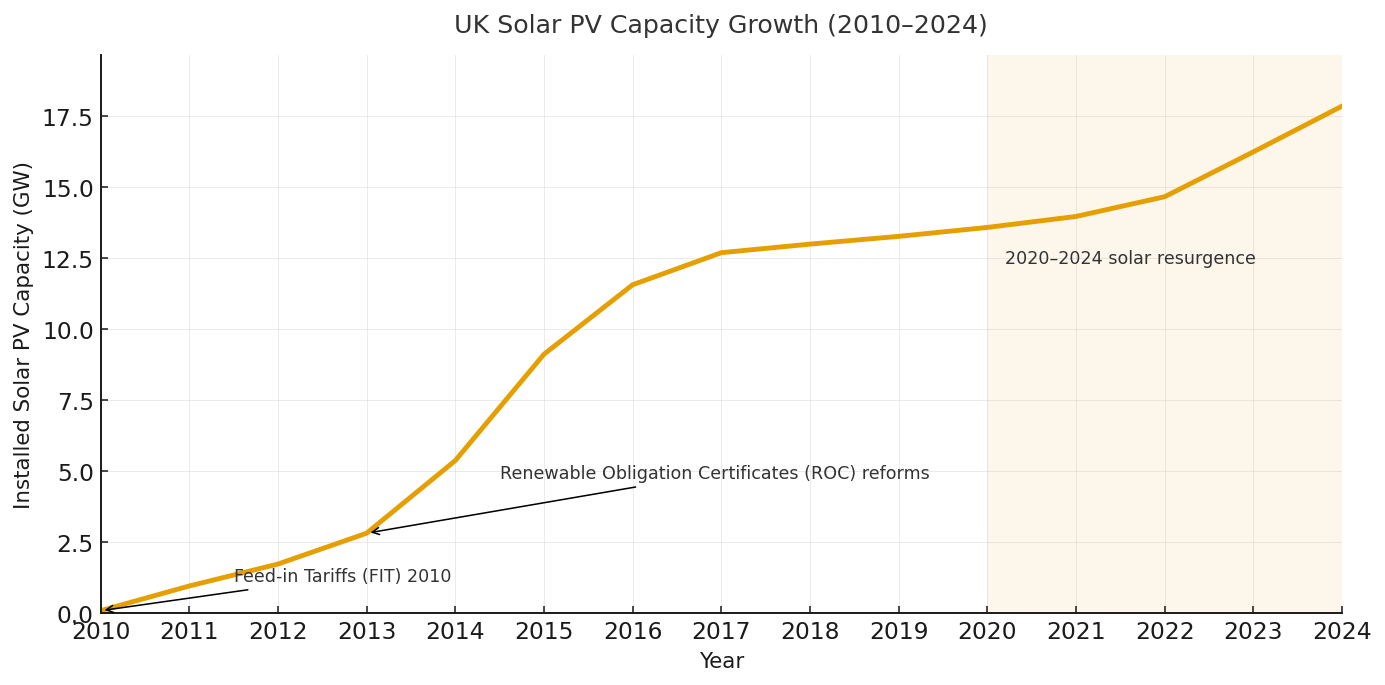
Fifteen years ago, solar was a niche technology; today it is foundational. Falling equipment costs, favourable government policy, and improved photovoltaic efficiency have driven exponential growth:
| Year | Installed Capacity (GW) | Source |
|---|---|---|
| 2010 | 0.1 GW | DESNZ (2023) |
| 2015 | 9.0 GW | Solar Energy UK (2023) |
| 2020 | 13.0 GW | IEA PVPS (2021) |
| 2024 | 16.2 GW | National Grid ESO (2024) |
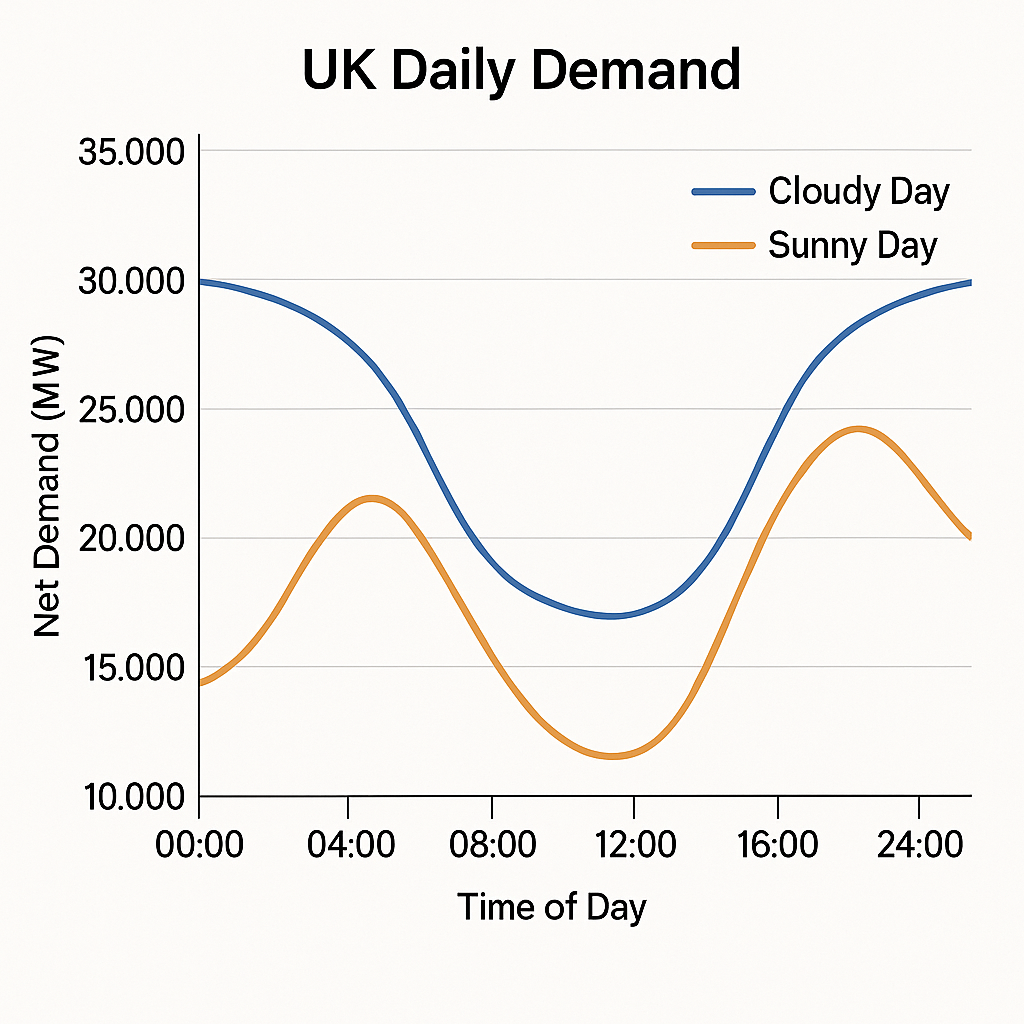
The Duck Curve Arrives in Britain
The grid's challenge is no longer simply meeting demand but managing when power arrives. The UK now experiences the "duck curve," where midday electricity demand drops sharply as solar generation surges, only to rebound steeply at sunset (Denholm et al., 2015).
This profile pressures operators to ramp up flexible generation such as gas turbines, pumped storage, and batteries during evening hours.
Breaking Solar Records
Recent data highlight solar's increasing significance:
- Peak output: 10.5 GW (May 2024)
- Single-day generation record: 150 GWh
- Peak share of total demand: 34%
- Consecutive hours above 5 GW generation: 8 (summer solstice)
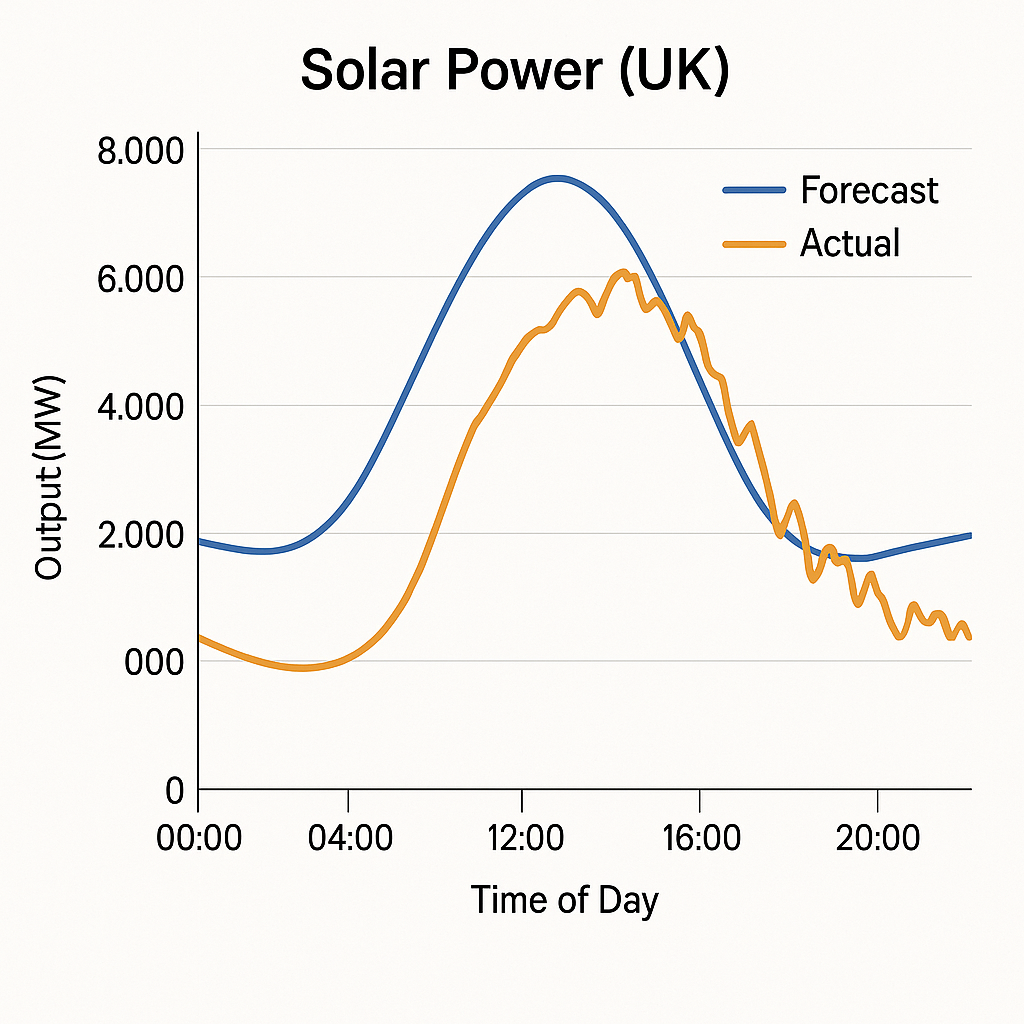
Forecasting and Managing Variability
Solar output can fluctuate rapidly as cloud formations pass. A 2022 study found that irradiance variability can cut local solar generation by up to 70% in a matter of minutes (Richardson et al., 2022).
To anticipate this, National Grid ESO integrates several forecasting approaches:
- Satellite-based cloud and irradiance mapping (Met Office, 2024)
- Short-term predictive models using machine learning (Bright et al., 2023)
- Automated ground-sensor networks and real-time sky cameras
Forecasting accuracy now approaches ±5% for 24-hour projections, improving balancing dispatch efficiency.
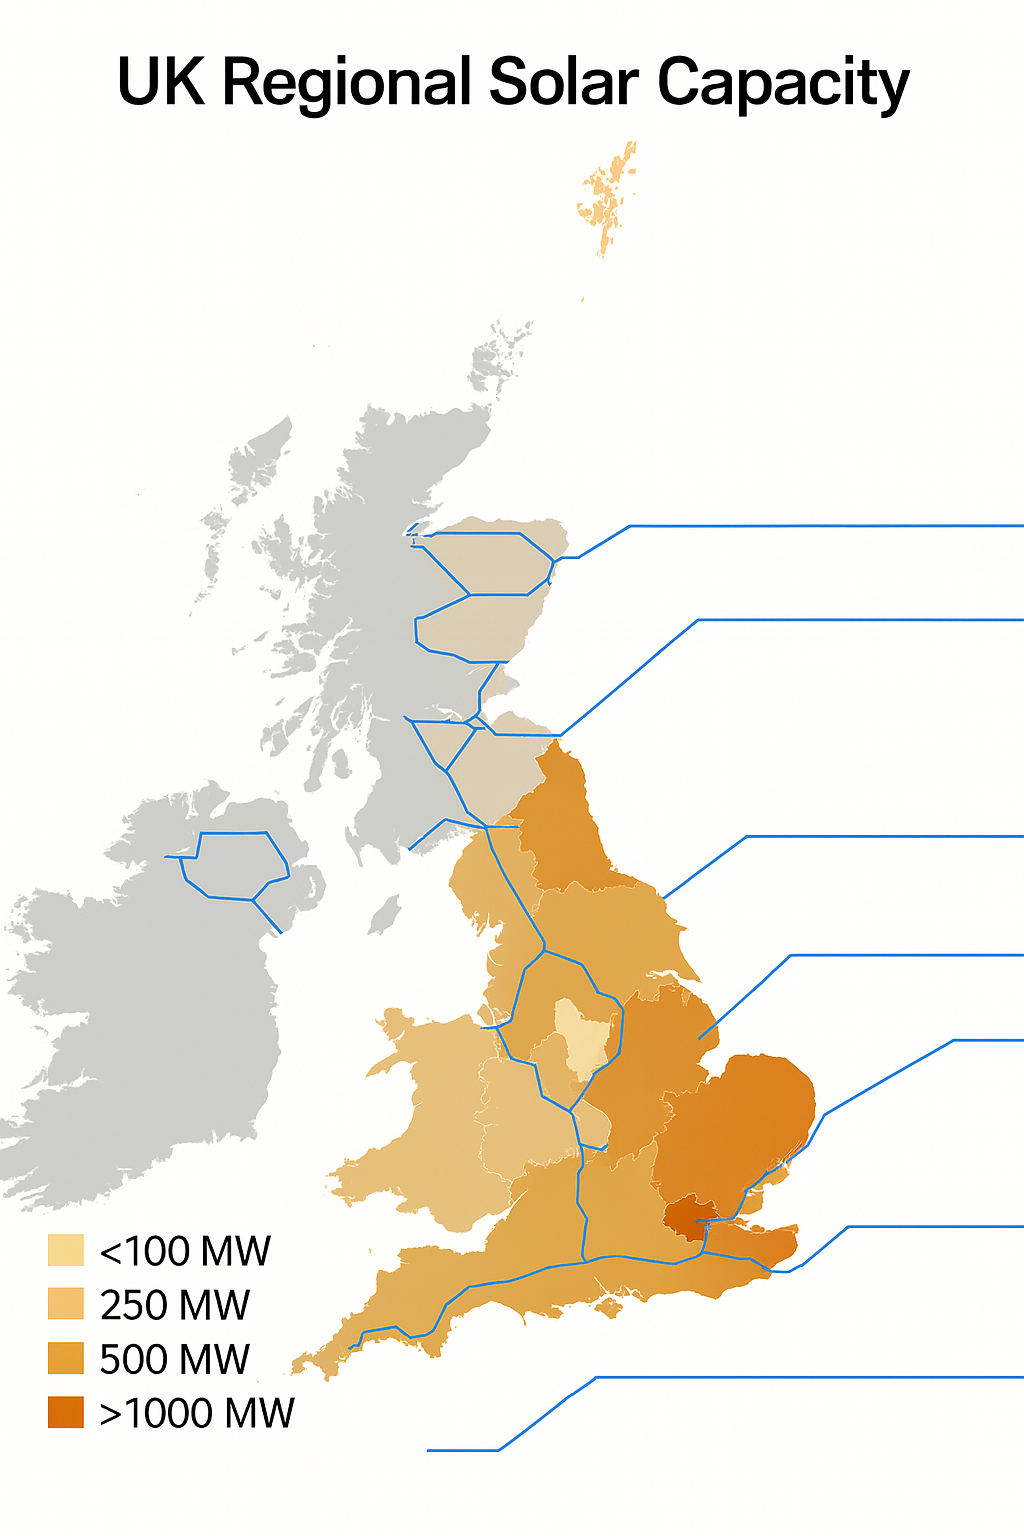
The Geography of Generation
Most PV capacity clusters in southern England, where irradiance levels are highest, while Scotland's generation leans toward wind. This uneven resource distribution adds complexity to grid balancing across the north-south axis (National Grid ESO FES, 2024).
Night, Winter, and the Balancing Mix
When night arrives and solar switches off, the system relies on:
- Nuclear for stable baseload
- Gas turbines for fast response
- Wind farms that frequently perform well overnight
- Interconnectors with Europe for imports and exports
- Battery and pumped hydro storage for short-duration energy shifts (Cornwall Insight, 2023)
During winter, solar generation can fall to one-fifth of summer output, highlighting seasonal balancing as a key research and technology focus.
Innovation in Solar Deployment
Technological advances continue to enhance the performance and integration of solar energy:
- Bifacial panels that capture reflected light and boost output by up to 30% (Fraunhofer ISE, 2023)
- Floating solar projects that generate power on reservoirs while reducing water evaporation
- Agrivoltaics allowing dual use of farmland for energy and food
- Building-integrated photovoltaics (BIPV) that merge panels into rooftops and facades
Looking Toward 2030
The UK's 2030 target of over 40 GW of solar generation (DESNZ, 2023) underscores solar's growing role in a flexible, decentralised grid ecosystem.
Storage, smart EV charging, and hydrogen electrolysis will allow the system to absorb excess midday energy and redistribute it across the day or season.
For real-time insight, GridMix's dashboard visualizes these transitions daily. Users can track live solar output, compare days, and observe how Britain's generation curve evolves through each season.
References
- Bright, J. M., et al. (2023). Advances in photovoltaic forecasting using machine learning. Renewable Energy, 214, 1421–1432.
- Cornwall Insight. (2023). UK energy storage market outlook 2025.
- Denholm, P., et al. (2015). Overgeneration from solar energy in California: A study of the duck curve. NREL Technical Report NREL/TP-6A20-65023.
- Department for Energy Security and Net Zero (DESNZ). (2023). UK Solar Capacity Statistics.
- Fraunhofer Institute for Solar Energy Systems ISE. (2023). Photovoltaics Report 2023.
- International Energy Agency Photovoltaic Power Systems Programme (IEA PVPS). (2021). Trends in Photovoltaic Applications.
- Met Office. (2024). Solar irradiance forecasting for UK grid balancing.
- National Grid Electricity System Operator (ESO). (2024). Operational Data Portal & Future Energy Scenarios Report.
- Richardson, S., et al. (2022). Short-term variability of solar power in the UK. Energy Systems Journal, 13(4), 987–1002.
- Solar Energy UK. (2023). Annual Solar Market Outlook.
See It in Real-Time
Experience the UK grid data we've been discussing—live, updated every 30 seconds, on our interactive dashboard.
Launch Dashboard